Visualization
This page contains various functions to visualize functions.
Plot_1D
- pmutt.plot_1D(obj, x_name, x_values, methods, nrows=None, ncols=None, viewer='matplotlib', figure=None, ax=None, **kwargs)
Make a 1D plot
- Parameters:
obj (Any model, species, or reaction object) – pMuTT object to evaluate
x_name (str) – Name of variable to vary
x_values (iterable object) – x values to use
nrows (int, optional) – Number of rows of the subplot grid. It not specified, defaults to length of
methodsncols (int, optional) – Number of columns of the subplot grid. If not specified, defaults to 1
figure (matplotlib.figure.Figure, optional) – Add plot to this figure. If not specified, one will be generated
ax ((N,) list of matplotlib.axes.Axes.axis, optional) – Adds plot to this axis. If not specified, one will be generated
kwargs (keyword arguments) –
Other variables to use in the calculation. Method specific arguments can be passed by having a key that corresponds to the method name
- e.g. kwargs = {‘get_H_kwargs’: {‘units’: ‘kcal/mol’},
’get_S_kwargs’: {‘units’: ‘cal/mol/K’}}
- Returns:
figure (matplotlib.figure.Figure) – Figure
ax ((N,) list of matplotlib.axes.Axes.axis) – Axes of the plots.
Example
Below, we plot the enthalpy, entropy, and Gibbs energy of a water molecule as a function of temperature at 1 bar and 10 bar.
import numpy as np
from pmutt import plot_1D
from pmutt.examples import H2O_statmech
from matplotlib import pyplot as plt

T = np.linspace(300., 500.) # K
fig1, ax1 = plot_1D(H2O_statmech, x_name='T', x_values=T,
                    methods=('get_H', 'get_S', 'get_G'),
                    get_H_kwargs={'units':'kcal/mol'},
                    get_S_kwargs={'units':'cal/mol/K'},
                    get_G_kwargs={'units': 'kcal/mol'})

# Passing the figure and ax arguments superimpose the plots
fig1, ax1 = plot_1D(H2O_statmech, x_name='T', x_values=T,
                    P=10., methods=('get_H', 'get_S', 'get_G'),
                    get_H_kwargs={'units':'kcal/mol'},
                    get_S_kwargs={'units':'cal/mol/K'},
                    get_G_kwargs={'units': 'kcal/mol'},
                    figure=fig1, ax=ax1)

# Add legend to matplotlib axes
ax1[2].legend(['1 bar', '10 bar'])
ax1[0].set_ylabel('H (kcal/mol)')
ax1[1].set_ylabel('S (cal/mol/K)')
ax1[2].set_ylabel('G (kcal/mol)')
plt.show()

Plot_2D
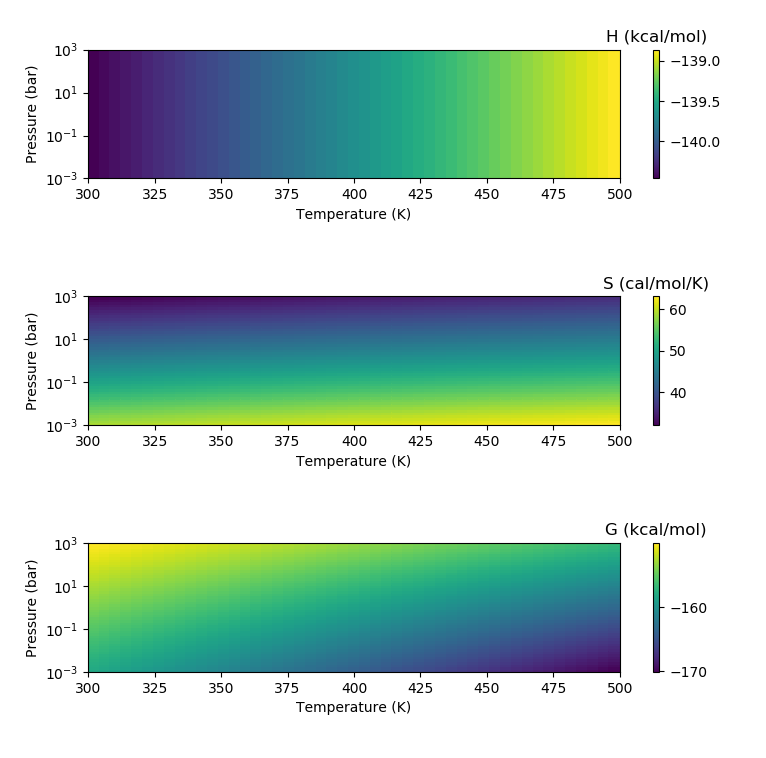
Below, we plot the enthalpy, entropy, and Gibbs energy of a water molecule as a function of temperature and pressure.
- pmutt.plot_2D(obj, x1_name, x1_values, x2_name, x2_values, methods, nrows=None, ncols=None, **kwargs)
Make a 2D plot
- Parameters:
obj (Any model, species, or reaction object) – pMuTT object to evaluate
x1_name (str) – Name of first variable to vary
x1_values (iterable object) – x1 values to use
x2_name (str) – Name of second variable to vary
x2_values (iterable object) – x2 values to use
nrows (int, optional) – Number of rows of the subplot grid. It not specified, defaults to length of
methodsncols (int, optional) – Number of columns of the subplot grid. If not specified, defaults to 1
kwargs (keyword arguments) –
Other variables to use in the calculation. Method specific arguments can be passed by having a key that corresponds to the method name
- e.g. kwargs = {‘get_H’: {‘units’: ‘kcal/mol’},
’get_S’: {‘units’: ‘cal/mol/K’}}
- Returns:
figure (matplotlib.figure.Figure) – Figure
ax ((N,) list of matplotlib.axes.Axes.axis) – Axes of the plots.
c ((N,) list of matplotlib.collections.QuadMesh) – Heatmap plots
cbar ((N,) list of matplotlib.colorbar.Colorbar) – Colorbar for plots
Example
import numpy as np
from pmutt import plot_2D
from pmutt.examples import H2O_statmech
from matplotlib import pyplot as plt

T = np.linspace(300., 500.) # K
P = np.logspace(-3, 3) # bar

fig1, ax1, c1, cbar1 = plot_2D(H2O_statmech,
                               x1_name='T', x1_values=T,
                               x2_name='P', x2_values=P,
                               methods=('get_H', 'get_S', 'get_G'),
                               get_H_kwargs={'units':'kcal/mol'},
                               get_S_kwargs={'units':'cal/mol/K'},
                               get_G_kwargs={'units': 'kcal/mol'})
plt.show()